How to Use Trend Lines and Price Channel


Trend lines and price channels are the key instruments in technical analysis. Learn how to apply them in your trading effectively and make the right trading decisions.
Uptrend line
An upward-sloping straight line that connects the lowest points in the chart is called an uptrend line. It indicates a positive trend in the market. These lines can serve as a guide to identifying support and resistance levels, as well as to spot buying opportunities when the price intersects with the line. They can also aid in managing risk and devising effective trading strategies.

An example of an uptrend line is situated below the low levels that the price bounced off of. The uptrend line is drawn temporarily between points 1 and 3, where the lowest levels that the price bounced off of are located. To confirm the validity of the uptrend line, it was necessary to test this line for the third time (at point 5).
Downtrend line
In chart analysis, a downtrend line is a straight line that slopes downwards to the right, connecting the high peaks. This line indicates a bearish trend in the market. Traders can use downtrend lines to identify support and resistance levels, as well as potential selling opportunities when the price intersects with the line. Additionally, downtrend lines can help manage risk and develop effective trading strategies.

A descending trend line was drawn above the descending price highs (a temporary trend line was drawn between points (1-3) and then tested at point 5 to make sure it is correct.
Why use a trend line?
For a trader, there are different ways to make the most of trend lines. These include:
Identifying buying and selling points: Trend lines can help you spot areas of support and resistance in the market. You can then base your trading decisions on these levels.
Exiting trades early: You can also use trend lines as exit points for your open trades. Once the line is broken, it’s an early signal of a trend reversal.
Determining the trend: The direction of the trend line and how it aligns with the general price movement can help you determine the overall trend of the market.
Placing automated orders: Trend lines can be used to automate trading orders such as stop-loss and target orders. This method is based on the support and resistance levels you’ve identified and the market’s general trend.
How to draw a trend line
If you want to draw a trend line, you need to observe a trend in the market. This means identifying at least two instances where the price bounced off of low levels, with the second low being higher than the first one.
Once you have found these two ascending low levels, you can draw a straight line between them and extend it upwards to the right. The trend line is considered valid if the price touches it for the third time.
It is necessary to have a minimum of two points to indicate a trend and a third point to confirm the trend line. These two points should represent the lowest or highest price points in an uptrend or downtrend respectively.
How to use trend lines for trading?
It’s important to note that trend lines should be used in conjunction with other analytical tools and methods to make informed decisions in the market.

In an uptrend, the nearby low levels can be used as buying areas. Points 5 and 7 can be used as entry points for new buying trades. Point 9 is called a profit-taking point for buying trades, indicating a potential reversal of the uptrend.

Points 5 and 7 can be used as selling areas, and a break of the trend line at point 9 signals a potential reversal of the trend.
It is essential to understand that the importance of a trend line is determined by the length of the line that has remained unbroken and the frequency of its testing. A trend line that has been tested eight times holds more significance than one that has been tested only three times. Moreover, a trend line that has been in place for nine months is more significant than one that has only been there for nine weeks or nine days.
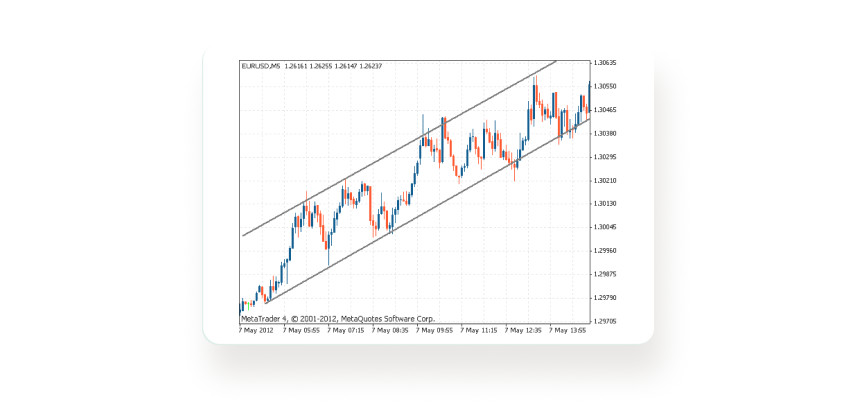
Price channel
Essentially, a price channel is created by drawing two parallel lines that encapsulate market price movement. The upper line represents resistance, while the lower line represents support. To determine the channel, parallel lines are drawn to touch the price movement at as many points as possible.
One can use price channels to determine when to enter or exit the market. If the price surpasses the upper resistance line, it suggests that the upward trend may continue. On the other hand, if the price falls below the lower support line, it suggests that the downward trend may continue. Moreover, price channels can help place stop-loss and target orders.
It is important to confirm the validity of a price channel by observing the price movement multiple times at the support and resistance levels specified by the channel, just like with the overall trend line.
Sign in to start trading with the trend lines and price channel now!


