How to Trade the Rectangle Pattern

The rectangle pattern is a tool used in technical analysis that signifies a market where the price oscillates between two horizontal lines, known as support and resistance levels. In this article, you’ll learn how to identify the rectangle pattern on a chart and use it in trading.
What is the rectangle pattern?
A rectangle is a chart pattern that indicates range-bound markets as buying and selling pressures are evenly matched.
The rectangle pattern forms when the price of a security moves between horizontal support and resistance levels, creating a “rectangle” on the chart. This pattern indicates a market in a state of indecision, as prices fluctuate between these well-defined boundaries.
The rectangle pattern can serve as either a continuation or a reversal pattern. A breakout from the rectangle may signal the start of a new trend or the resumption of the previous one, so it’s important to know how to trade this pattern.
Types of rectangle patterns
There can be two types of rectangle patterns:
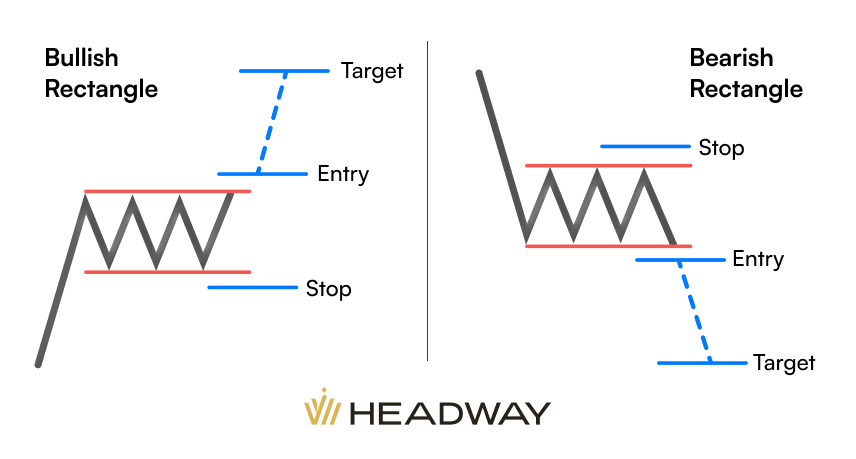
- Bullish rectangle. This pattern forms during a strong uptrend. In a bullish rectangle pattern, the price consolidates within a rectangular range after an uptrend. Traders anticipate a bullish breakout, where the price moves above the upper resistance level, indicating a continuation of the prior uptrend.
- Bearish rectangle. This pattern is the mirror image of the bullish pattern. It starts with a price decrease, followed by a range with a rectangular shape. Traders expect a bearish breakout, where the price drops below the lower support level, signaling a continuation of the preceding downtrend.

How to identify a rectangle pattern
Identifying a rectangle pattern involves recognizing specific characteristics in the price action of an asset. Here are the steps to identify a rectangle pattern:
- Identify the prior trend. Before the formation of a rectangle pattern, there should be a preceding trend, either upward (for a bullish rectangle) or downward (for a bearish rectangle). This trend is essential as the rectangle pattern typically represents a consolidation phase within the broader trend.
- Locate support and resistance levels. Look for at least two significant swing highs and two significant swing lows that create parallel horizontal lines, forming the upper resistance and lower support levels of the rectangle pattern. These levels should be roughly equal in distance and run parallel to each other.
- Observe trading volume. During the consolidation phase within the rectangle pattern, trading volume tends to diminish. Lower volume suggests decreased participation and uncertainty in the market.
By following these steps, traders can effectively identify rectangle patterns and use them to anticipate potential price movements and trading opportunities in the market.
Is the rectangle pattern reversal or bullish?
The rectangle pattern itself is neither inherently bullish nor bearish; it is a neutral continuation pattern. However, how it is interpreted depends on its context within the broader market trend.
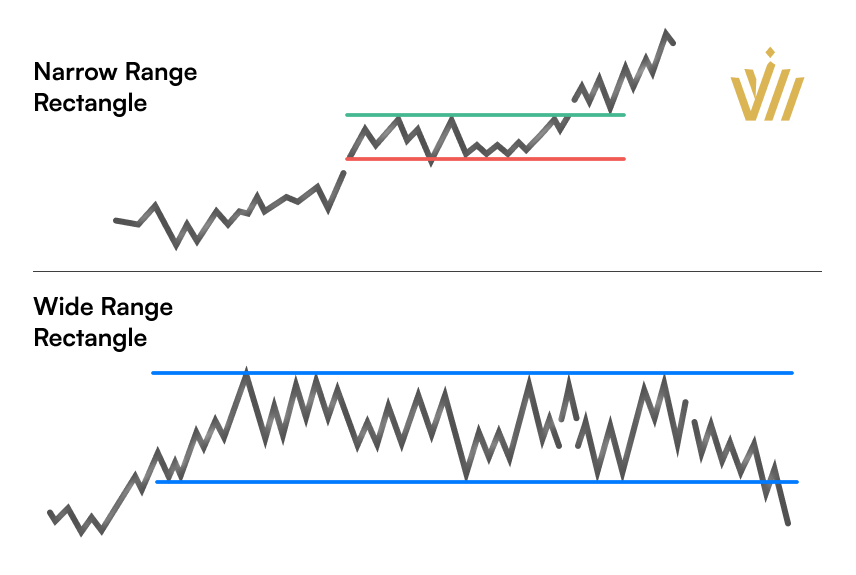
Some experts differentiate between narrow-range and wide-range rectangles.
Narrow range rectangles are characterized by a relatively tight consolidation range where the price oscillates within a small price range. These patterns often indicate low volatility and indecision, so tighter ranges might signify a potential continuation.
On the other hand, wide-range triangles feature a broader consolidation range where the price fluctuates within a wider price range. These patterns typically indicate higher volatility and potentially stronger accumulation or distribution by market participants. Because of this, wide-range triangles are more likely to lead to a reversal of the trend.

How to trade rectangle patterns
There are two main strategies for trading rectangle patterns.
Range trading strategy
This strategy is about profiting off the price swings within the rectangle itself.
- Trade within the range of the rectangle pattern until a breakout occurs.
- Buy near the support level and sell near the resistance level.
- Take profits at the opposite boundary of the range and use tight stop-loss orders to manage risk.
This strategy is suitable for traders who prefer range-bound markets and shorter-term trades.
Breakout trading strategy
Trading the breakout of a rectangle pattern involves capitalizing on the potential price movement that occurs when the price breaks out of the consolidation phase.
- Identify the rectangle. Use technical analysis to identify a rectangle pattern on the price chart. Look for a series of relatively equal highs and lows, forming parallel support and resistance levels.
- Confirm the pattern. Ensure that the rectangle pattern has been established with at least two touches of the upper resistance level and two touches of the lower support level. The more touches, the stronger the pattern.
- Wait for breakout confirmation. Wait for the price to break decisively above the upper resistance level (for a bullish breakout) or below the lower support level (for a bearish breakout).
- Confirm breakout with volume. Confirm the breakout with increased trading volume. Ideally, the volume should expand during the breakout, indicating strong participation and conviction from market participants. Higher volume lends credibility to the breakout and increases the likelihood of follow-through momentum.
- Place entry order. Once the breakout is confirmed, place a market order to enter the trade in the direction of the breakout (buy for a bullish breakout, sell short for a bearish breakout). Alternatively, you can use a Buy Stop order above the upper resistance level or a Sell Stop order below the lower support level to enter the trade automatically once the breakout occurs.
- Set Stop-Loss and Take-Profit orders. Place a Stop-Loss order below the breakout point (for bullish breakout) or above the breakout point (for bearish breakout) to limit potential losses if the breakout fails. Determine a profit target based on the height of the rectangle pattern. Measure the distance between the support and resistance levels of the rectangle and project it in the direction of the breakout.
Remember that breakout trading carries risks, including false breakouts and whipsaws. It’s essential to combine breakout signals with other technical analysis tools and risk management techniques to increase the probability of successful trades. Additionally, practice patience and discipline in executing the strategy consistently over time.
Conclusion: Trading rectangle patterns
The rectangle pattern is a versatile technical analysis tool that offers traders valuable insights into market dynamics and potential price movements. By identifying and understanding the characteristics of rectangle patterns, traders can capitalize on breakout opportunities to achieve profitable trades.
While rectangle patterns can provide valuable trading opportunities, it’s important to remember that no trading strategy is foolproof. Traders should remain disciplined, patient, and adaptable, continuously learning and refining their skills to navigate the complexities of financial markets.
Follow us on Telegram, Instagram, and Facebook to get Headway updates instantly.


