Hammer (Pin Bar) Candlestick Pattern: 3 Beginner Strategies to Define Entry Points


Candlestick patterns are helpful when you search for trend reversals and reliable market entry points. In this article, we explore three easy strategies for beginners based on the hammer (pin bar) candlestick pattern.
Candlestick chart and a pin bar candle
A candlestick chart is a type of trading chart that reflects price movements over certain periods of time. Each candlestick shows the price change over a minute, hour, day, and other timeframes. A candle has a body and a wick.
A body is rectangular and shows the opening/closing price range. When the closing price is higher, the body is green, meaning the movement is bullish. The body is red if the closing price is lower, indicating a bearish move.
A wick is a line above and below the body. It represents the price range during the given period, outside of the opening/closing range. Short wicks or no wicks indicate that the price isn’t moving much. Long wicks indicate high market activity: If it is a long upper wick, there is strong pressure from buyers; if it is a long lower wick, the sellers are pressuring the price.
In other words, the wick’s length and position can help you interpret the trends and detect reversals. And the pin bar candle is perfect for that.
A pin bar, or candlestick hammer, is a reversal candlestick pattern that appears when the price opens and closes approximately in the same area. It is characterized by a long wick and a small body. The pin bar is a strong signal for a potential reversal.
The key feature of a pin bar is its long wick. It should be ⅔ of the candlestick length or more.

With a small body and short or no opposite wick, it becomes a clear sign of current market uncertainty and close trend reversal. If you see a hammer candlestick near support/resistance levels or Moving Averages, they are even more significant.
Strategy 1. Find a bullish pin bar – this is your ‘buy’ signal
The bullish pin bar candlestick has a small body of any color and a long lower wick. It appears at the end of a downtrend so it can be a signal for a potential bullish reversal.
You can see a bullish hammer candle when sellers push the price but the buyers reject it. The longer the wick, the stronger the buyers.
When bullish candlesticks close higher after the bullish pin bar, the trend is reversed. This is a good time to enter the market with a ‘buy’ order. Local support and resistance levels will help you set the right Stop-Loss and Take-Profit.


Example. We open the EURUSD chart, timeframe H1 (1 hour). We easily find a long-bodied hammer candle with an upper wick. Historic price movement proves the general trend that this candle gives us. We could enter the trade here and profit from it.

Strategy 2. Find a bearish pin bar – this is your ‘sell’ signal
You can use the first strategy the other way around for a bearish pin bar to open a position. In such a case, you want to find a bearish hammer candlestick to detect a new downward trend.
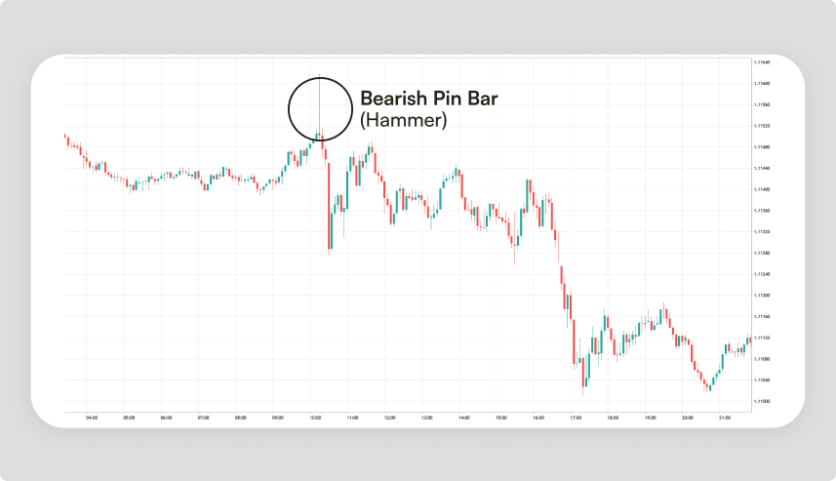
The bearish pin bar candlestick has a small body of any color and a long upper wick. It appears at the end of an uptrend so it can be a signal for a potential bearish turn.
You can see a bullish hammer candle when buyers push the price but sellers reject it. The longer the wick, the stronger the sellers.
When bearish candlesticks close below the bearish pin bar, the trend is reversed. This is a good time to enter the market with a ‘sell’ position. Local support and resistance levels will help you set the right Stop-Loss and Take-Profit.


Example. We open the EURUSD chart. This time, let’s use a smaller timeframe, M5 (5 minutes). When we look at the chart, we find one outstanding candlestick, a bearish hammer with a very long upper wick. This is our opportunity to sell. As we can see in the chart, the trend is downward, so our ‘sell’ order would bring good benefits.
Strategy 3. Find an inside bar – this is a sign of a trend’s ending
A pin bar can also be an inside bar. An inside bar, also known as a Harami pattern, is a combination of two candlesticks where one bar is within the limits of another. Such a combination can be seen below support or above resistance levels. In this case, an inside bar indicates that the current trend has ended and a trend change may follow soon: The price can reverse or stay in a range.

Here is how it works in the context. We find a bearish bar, and right next goes the bullish bar (or the other way around). The body and wicks of the bullish bar are fully within the range of the bearish bar. After that combo, we see the downward trend reversal. If you find such a formation in your chart, opening a ‘sell’ position would be a good opportunity.

Example. Let’s use the daily chart for Apple (AAPL). We notice a green bar inside the long red bar. Here, we conclude that the current trend is about to change. The historical data proves that point: The price goes straight up. If we opened a ‘buy’ order here, we would profit from it.

Conclusion: Hammer (Pin Bar) Candlestick Pattern
As you can see, the pin bar patterns can be a helpful tool in your trading. Remember to test the suggested entry points with other technical indicators to ensure your 100% results. Choose any of the three strategies to try now on Headway.
Follow us on Telegram, Instagram, and Facebook to get the Headway updates instantly.


